
Bone marrow
Updates to Article Attributes
Normal bone marrow is divided into red and yellow marrow, a distinction made on the grounds of how much fat it contains.
Gross anatomy
Red marrow is composed of:
haematopoietic cells
supporting stroma
reticulum (phagocytes and undifferentiated progenitor cells)
scattered fat cells
arich vascular supply
Conversely, yellow marrow has all the same constituents as red, except that fat cells make up the vast majority (80% vs 40% in red marrow), with resulting poor vascularity. Distribution varies with age and from one individual to another but should be symmetric.
Normal marrow conversion
During infancy red marrow occupies the entire ossified skeleton except for epiphyses and apophyses. Gradually red marrow 'retreats'"retreats" centrally, such that by 25 years of age it is essentially confined to the axial skeleton (pelvis, spine, shoulder girdle, skull). The conversion of red to yellow marrow progresses from distal to proximal of the extremities, so first hands and feet, then forearms/lower legs, then humeri/femora, then pelvis/spine.
Within the long bones, the epiphysis is the first to undergo conversion followed by the diaphysis before extending to the metadiaphysis 5,6.
Also, islands of red marrow may be seen anywhere in the skeleton, typically in a subcortical distribution, often with central yellow marrow giving it a bull's eye appearance on axial imaging. Additionally, red marrow is found in subchondral crescents, typical locations include the proximal humerus and femur 2.
Yellow marrow can also be seen focally in vertebra around the basivertebral vein, adjacent to degenerative disc disease and Schmörl nodes, and within haemangiomas.
Several patterns of normal red and yellow bone marrow distribution in the spine have been described by Ricci9.
Radiographic features
MRI
Signal characteristics
-
T1
red marrow: hypointense to subcutaneous fat, but hyperintense to muscle and disc (due to scattered fat cells)
yellow marrow: hyperintense (follows the signal of subcutaneous fat)
-
T2
red marrow: slightly hyperintense to muscle, usually its signal intensity is slightly lower than that of yellow marrow, but sometimes it can be difficult to distinguish the two
yellow marrow: hyperintense to muscle and iso- to slightly hypointense to subcutaneous fat
-
STIR
red marrow: remains hyperintense
yellow marrow: is saturated out (hypointense)
-
T1 C+
(Gad(Gd)normal bone marrow in adults does not enhance visibly, whereas there may be a significant contrast enhancement in normal marrow of a neonate or a small child
enhancement in adults occurs only in pathological marrow, which can be accentuated on post-contrast images with fat saturation
Related pathology
Broadly, marrow pathology can be divided into:
proliferation
depletion
replacement
vascular abnormalities
miscellaneous
Marrow proliferation
Benign
Malignant
-
monoclonal gammopathies(plasma) monoclonal gammopathies, e.g. monoclonal gammopathy of unknown significance (MGUS)
*
Most of the above conditions affect the marrow diffusely. The exception is multiple myeloma which has a predilection for focal deposits, and Waldenström macroglobulinaemia which causes infarcts.
The MRI appearance of pathological bone marrow is variable:
normal red marrow appearance (e.g. 10-25% of all leukaemic patients will have normal appearing marrow)
abnormal distribution of what appears to be normal red marrow
abnormal signal from red marrow in a normal distribution
abnormal signal and distribution
The abnormal signal is due to replacement of the small amounts of fat cells normally found in red marrow, such that T1 signal will decrease to or below the signal from disc or muscle. T2 signal is more variable, but will in general increase when compared to muscle.
Myelofibrosis and mastocytosis incite such prominent sclerosis that the marrow is very dark on both T1 and T2; a similar appearance to the marrow in haemosiderosis in patients with haemolysis from sickle cell disease and thalassaemia.
The leukaemias typically affect the metaphyses >, then diaphyses >, followed by the epiphyses. Changes in the latter indicate a large tumour load, and therefore has prognostic implications.
-<li><p>a rich vascular supply</p></li>-</ul><p>Conversely, <strong>yellow marrow </strong>has all the same constituents as red, except that fat cells make up the vast majority (80% vs 40% in red marrow), with resulting poor vascularity. Distribution varies with age and from one individual to another but should be symmetric.</p><h5>Normal marrow conversion</h5><p>During infancy red marrow occupies the entire ossified skeleton except for epiphyses and apophyses. Gradually red marrow 'retreats' centrally, such that by 25 years of age it is essentially confined to the axial skeleton (pelvis, spine, shoulder girdle, skull). The conversion of red to yellow marrow progresses from distal to proximal of the extremities, so first hands and feet, then forearms/lower legs, then humeri/femora, then pelvis/spine.</p><p>Within the long bones, the epiphysis is the first to undergo conversion followed by the diaphysis before extending to the metadiaphysis <sup>5,6</sup>.</p><p>Also, islands of red marrow may be seen anywhere in the skeleton, typically in a subcortical distribution, often with central yellow marrow giving it a <a href="/articles/target-sign-disambiguation">bull's eye</a> appearance on axial imaging. Additionally, red marrow is found in subchondral crescents, typical locations include the proximal humerus and femur <sup>2</sup>.</p><p>Yellow marrow can also be seen focally in vertebra around the <a href="/articles/basivertebral-vein">basivertebral vein</a>, adjacent to <a href="/articles/degenerative-disc-disease">degenerative disc disease</a> and <a href="/articles/schmorl-nodes-3">Schmörl nodes</a>, and within <a href="/articles/haemangioma">haemangiomas</a>.</p><p>Several patterns of normal red and yellow <a href="/articles/patterns-of-normal-bone-marrow-distribution-in-the-spine">bone marrow distribution in the spine</a> have been described by Ricci.</p><h4>Radiographic features</h4><h5>MRI </h5><h6>Signal characteristics</h6><ul>- +<li><p>rich vascular supply</p></li>
- +</ul><p>Conversely, <strong>yellow marrow </strong>has all the same constituents as red, except that fat cells make up the vast majority (80% vs 40% in red marrow), with resulting poor vascularity. Distribution varies with age and from one individual to another but should be symmetric.</p><h5>Normal marrow conversion</h5><p>During infancy red marrow occupies the entire ossified skeleton except for epiphyses and apophyses. Gradually red marrow "retreats" centrally, such that by 25 years of age it is essentially confined to the axial skeleton (pelvis, spine, shoulder girdle, skull). The conversion of red to yellow marrow progresses from distal to proximal of the extremities, so first hands and feet, then forearms/lower legs, then humeri/femora, then pelvis/spine.</p><p>Within the long bones, the epiphysis is the first to undergo conversion followed by the diaphysis before extending to the metadiaphysis <sup>5,6</sup>.</p><p>Also, islands of red marrow may be seen anywhere in the skeleton, typically in a subcortical distribution, often with central yellow marrow giving it a <a href="/articles/target-sign-disambiguation">bull's eye</a> appearance on axial imaging. Additionally, red marrow is found in subchondral crescents, typical locations include the proximal humerus and femur <sup>2</sup>.</p><p>Yellow marrow can also be seen focally in vertebra around the <a href="/articles/basivertebral-vein">basivertebral vein</a>, adjacent to <a href="/articles/degenerative-disc-disease">degenerative disc disease</a> and <a href="/articles/schmorl-nodes-3">Schmörl nodes</a>, and within <a href="/articles/haemangioma">haemangiomas</a>.</p><p>Several patterns of normal red and yellow <a href="/articles/patterns-of-normal-bone-marrow-distribution-in-the-spine">bone marrow distribution in the spine</a> have been described by Ricci <sup>9</sup>.</p><h4>Radiographic features</h4><h5>MRI </h5><ul>
-<p><strong>T1 C+ (Gad)</strong></p>- +<p><strong>T1 C+ (Gd)</strong></p>
-<li><p><a href="/articles/polycythaemia-rubra-vera">polycythaemia rubra vera</a></p></li>- +<li><p><a href="/articles/polycythaemia-rubra-vera">polycythaemia vera</a></p></li>
-<p><a href="/articles/monoclonal-gammopathies">monoclonal gammopathies</a> (plasma cell dyscrasias)</p>- +<p>plasma cell dyscrasias</p>
-<li><p><a href="/articles/waldenstrom-macroglobulinaemia">Waldenstrom macroglobulinaemia</a></p></li>-<li><p><a href="/articles/lymphoproliferative-disorder">lymphoproliferative disorder</a></p></li>-<li><p><a href="/articles/monoclonal-gammopathy-of-undetermined-significance">monoclonal gammopathy of unknown significance</a> (MGUS) *</p></li>-<li><p><a href="/articles/monoclonal-gammopathy-of-borderline-significance">monoclonal gammopathy of borderline significance </a>*</p></li>-</ul><p>Most of the above conditions affect the marrow diffusely. The exception is <a href="/articles/multiple-myeloma-1">multiple myeloma</a> which has a predilection for focal deposits, and <a href="/articles/waldenstrom-macroglobulinaemia">Waldenstrom macroglobulinaemia</a> which causes infarcts.</p><p>The MRI appearance of pathological bone marrow is variable:</p><ul>- +<li><p>monoclonal gammopathies, e.g. <a href="/articles/monoclonal-gammopathy-of-undetermined-significance">monoclonal gammopathy of unknown significance</a> (MGUS)</p></li>
- +<li><p><a href="/articles/waldenstrom-macroglobulinaemia" title="Waldenström macroglobulinaemia">Waldenström macroglobulinaemia</a></p></li>
- +<li><p><a href="/articles/post-transplant-lymphoproliferative-disorder-2" title="PTLD">lymphoproliferative disorder</a></p></li>
- +</ul><p>Most of the above conditions affect the marrow diffusely. The exception is <a href="/articles/multiple-myeloma-1">multiple myeloma</a> which has a predilection for focal deposits, and <a href="/articles/waldenstrom-macroglobulinaemia" title="Waldenström macroglobulinaemia">Waldenström macroglobulinaemia</a> which causes infarcts.</p><p>The MRI appearance of pathological bone marrow is variable:</p><ul>
-</ul><p>The abnormal signal is due to replacement of the small amounts of fat cells normally found in red marrow, such that T1 signal will decrease to or below the signal from disc or muscle. T2 signal is more variable, but will in general increase when compared to muscle.</p><p><a href="/articles/primary-myelofibrosis">Myelofibrosis</a> and <a href="/articles/mastocytosis">mastocytosis</a> incite such prominent sclerosis that the marrow is very dark on both T1 and T2; a similar appearance to the marrow in <a href="/articles/haemosiderosis">haemosiderosis</a> in patients with <a href="/articles/haemolysis">haemolysis</a> from <a href="/articles/sickle-cell-disease">sickle cell disease</a> and <a href="/articles/thalassaemia">thalassaemia</a>.</p><p>The leukaemias typically affect the metaphyses > diaphyses > epiphyses. Changes in the latter indicate a large tumour load, and therefore has prognostic implications.</p>- +</ul><p>The abnormal signal is due to replacement of the small amounts of fat cells normally found in red marrow, such that T1 signal will decrease to or below the signal from disc or muscle. T2 signal is more variable, but will in general increase when compared to muscle.</p><p><a href="/articles/primary-myelofibrosis">Myelofibrosis</a> and <a href="/articles/mastocytosis">mastocytosis</a> incite such prominent sclerosis that the marrow is very dark on both T1 and T2; a similar appearance to the marrow in <a href="/articles/haemosiderosis">haemosiderosis</a> in patients with <a href="/articles/haemolysis">haemolysis</a> from <a href="/articles/sickle-cell-disease">sickle cell disease</a> and <a href="/articles/thalassaemia">thalassaemia</a>.</p><p>The leukaemias typically affect the metaphyses, then diaphyses, followed by the epiphyses. Changes in the latter indicate a large tumour load, and therefore has prognostic implications.</p>
References changed:
- 9. Ricci C, Cova M, Kang Y et al. Normal Age-Related Patterns of Cellular and Fatty Bone Marrow Distribution in the Axial Skeleton: MR Imaging Study. Radiology. 1990;177(1):83-8. <a href="https://doi.org/10.1148/radiology.177.1.2399343">doi:10.1148/radiology.177.1.2399343</a> - <a href="https://www.ncbi.nlm.nih.gov/pubmed/2399343">Pubmed</a>
Image 2 MRI (T1) ( update )

Image 3 MRI (T1) ( update )

Image 4 MRI (T2) ( update )
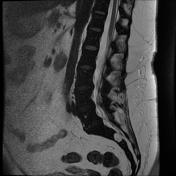
Image 5 Nuclear medicine ( update )


 Unable to process the form. Check for errors and try again.